
B2B Supplier Hub
How to Evaluate a Supplier From the Numbers Alone
You've found three suppliers offering the exact product you need. One is $2.50 a unit, another is $3.20, and the third doesn't show a price at all. The instinct is to click the cheapest one and spend a reveal credit right there.
But the lowest price on a listing isn't always the best deal, and sometimes it's the opposite. Before you spend a credit, the numbers already sitting on that listing—cost spread, stock depth, and the last-updated date—can tell you most of what you need to know about whether a supplier is actually worth pursuing.
Why the Numbers on a Listing Matter More Than the Price
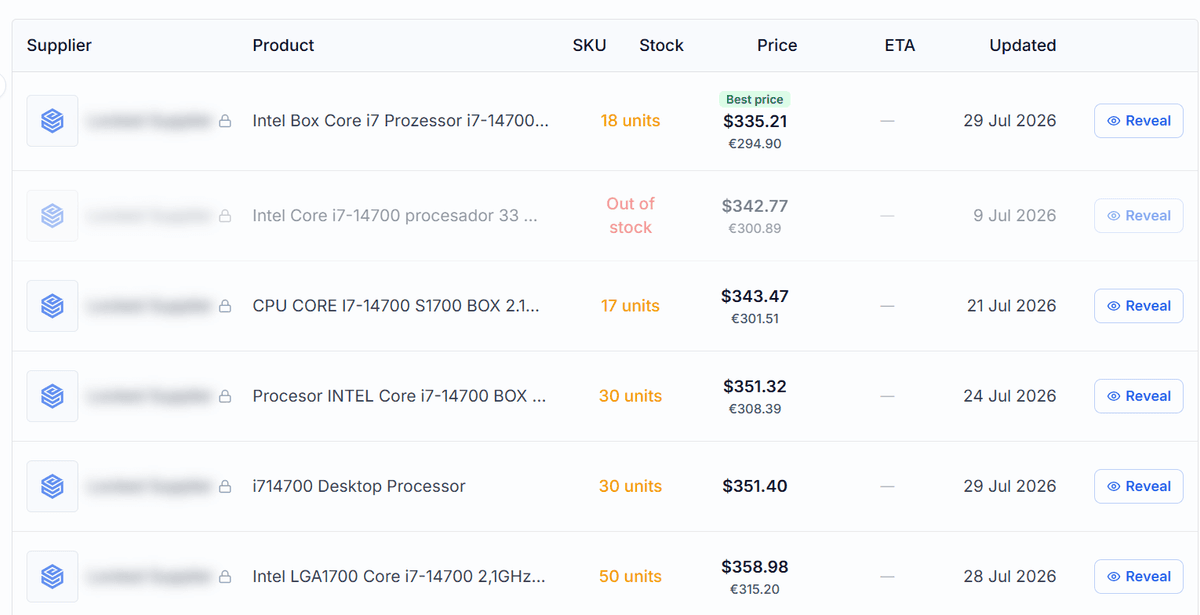
A masked supplier listing hides the supplier's name and contact details, but it doesn't hide much else. You can still see pricing across order quantities, how much stock they're holding, and when that information was last checked. Read together, these numbers say more about a supplier's operation than the price alone ever will.
Buyers who fixate only on unit price are judging the whole deal by one number. A price tells you what something costs today. It doesn't tell you whether the supplier can actually fill your order, whether their stock will still be there next week, or whether the listing you're looking at reflects reality or something from months ago. Getting this wrong costs real money: delayed shipments, price surprises after you've already reached out, and revealed credits spent on suppliers who were never a fit to begin with.
Cost Spread: What the Price Range Across Quantities Tells You
Cost spread is the gap between a supplier's price at the smallest order quantity and their price at the largest. Almost every wholesale listing is tiered, and how wide that tier spread runs says something about how the supplier is actually set up.
Take a simple example: $5.00 a unit at 1–10 units, dropping to $3.50 a unit at 100+. That's roughly a 30 percent spread from top to bottom.
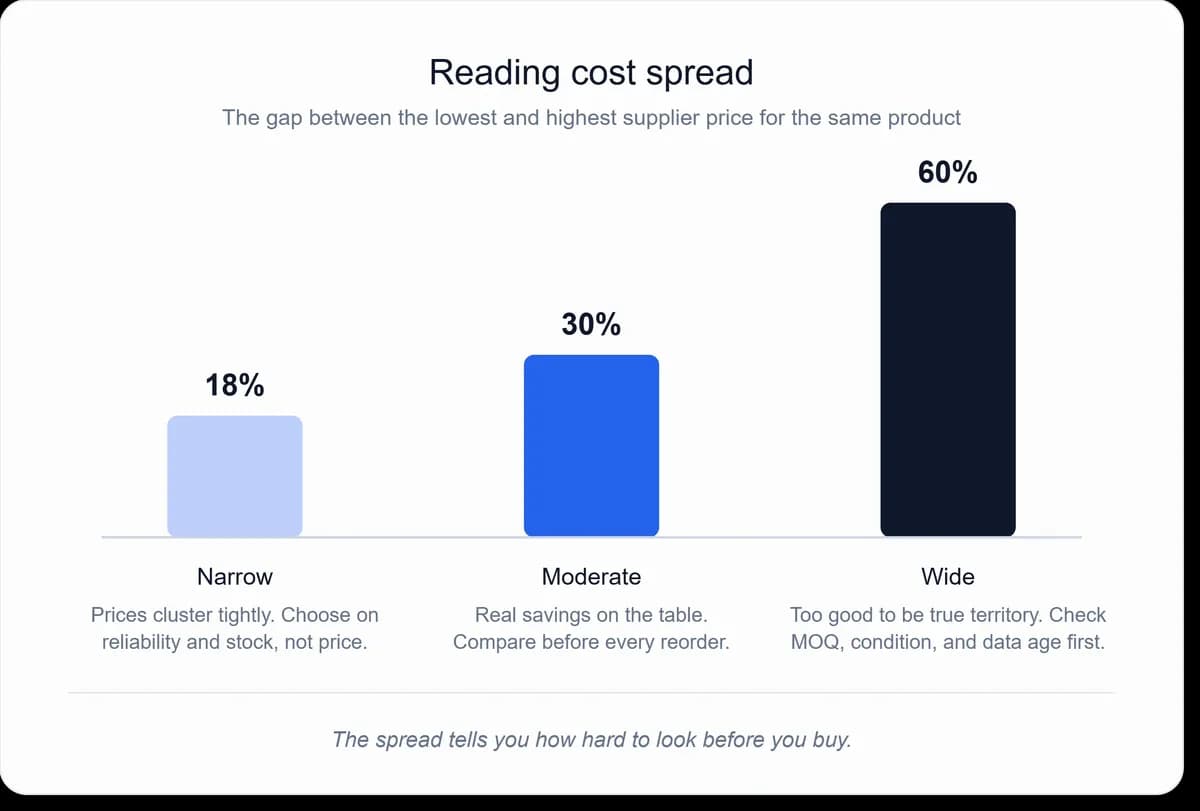
A spread in the 15 to 25 percent range is typical of an established operation. Their per-unit cost drops in a predictable way as volume goes up, which usually reflects real production efficiency rather than guesswork.
A spread past 40 percent is worth pausing on. It can mean the supplier is sitting on excess capacity and discounting hard to move it, that quality quietly slips at the smaller tiers, or that the low-volume price simply isn't sustainable and was set to win a listing rather than a real order.
A spread under 5 percent is less common, and it can go either way. Some suppliers keep pricing flat because they're confident in it. Others do it because they aren't set up to handle large orders efficiently and haven't built real volume pricing at all.
The spread matters most in comparison. Two suppliers offering the same product, one with an 18 percent spread and one with a 60 percent spread, are telling you two different stories about their business, well before you've spent anything to find out their name.
Stock Depth: Why 1 Unit and 83 Units Aren't What You Think
Stock depth is the second signal worth reading closely, and it's the one buyers misjudge most often.
A listing showing 1 unit in stock usually means the supplier works largely made-to-order, that they just sold through their last batch, or that the listing hasn't been touched in a while. None of those are automatically disqualifying, but they all mean you should expect a longer lead time than the price alone suggests.
A listing showing 50 to 500 units generally reflects a supplier who has committed real working capital to inventory, which is a reasonable sign of steady demand. A listing in the thousands can mean the same thing at a larger scale, or it can mean the product is moving slower than expected and the supplier is sitting on it.
Here's the part that trips people up: 83 units in stock is not automatically the better listing than 1 unit in stock. It depends entirely on what you're actually ordering. Restocking a listing that sells daily, the 83-unit supplier is the safer choice.
Placing a one-time order for a handful of units, the 1-unit supplier might have fresher inventory and a sharper price since they're not carrying the overhead of a large standing stock. Planning a 500-unit order, neither of them is really enough, and you're looking for a different supplier entirely.
The number worth checking against stock depth is the supplier's minimum order quantity. A stock of 50 units against an MOQ of 100 doesn't add up. A stock of 500 units against an MOQ of 1. When the two don't line up, that's usually a sign the listing needs a second look before you spend a credit on it.
The Last-Updated Date: Why Freshness Changes Everything Else
The last-updated date is the one number that puts the other two in context, and it's the one most buyers skip past entirely. It tells you when the supplier last touched their listing, whether that's price, stock, or contact details.
A listing updated in the last 30 days is a good sign. The supplier is actively managing it, and the numbers you're looking at are likely to hold. Somewhere between 30 and 90 days isn't a red flag by itself, but it's worth a quick gut check on whether the price and stock figures still seem realistic.
Past 90 days, and especially past six months, treat the numbers as a starting point rather than something to rely on. A supplier might be genuinely serving customers through other channels and simply not prioritizing this listing, or the listing might just be neglected. Either way, the 1,200 units shown from seven months ago are not the same as 1,200 units confirmed this week.
There's one exception worth knowing. Some listings stay untouched for months simply because nothing about them has changed: same price, same stock, same terms. That's different from a listing that should have changed, say a seasonal product heading into its busy period, but hasn't been touched. The second case is the one to be cautious about.
Reading All Three Numbers Together
Individually, cost spread, stock depth, and the last-updated date are each useful. Together, they tell you what kind of supplier you're actually looking at before you've spent anything to find out.
A 55 percent spread and 3 units in stock, updated 15 days ago, reads like a newer supplier pushing on price to get noticed. Engaged and current, but not yet holding real inventory, so expect a longer lead time.
An 18 percent spread and 320 units in stock, updated 45 days ago, read like a stable, established operation. This is usually the safer choice for ongoing, predictable orders.
A 22 percent spread and 1,200 units in stock, updated 210 days ago, read like good numbers on paper attached to a listing nobody's touched in seven months. Worth a direct message before assuming any of it is current.
When the "Best Price" Tag Isn't the Best Choice
This is the part that costs buyers real money if they skip it.
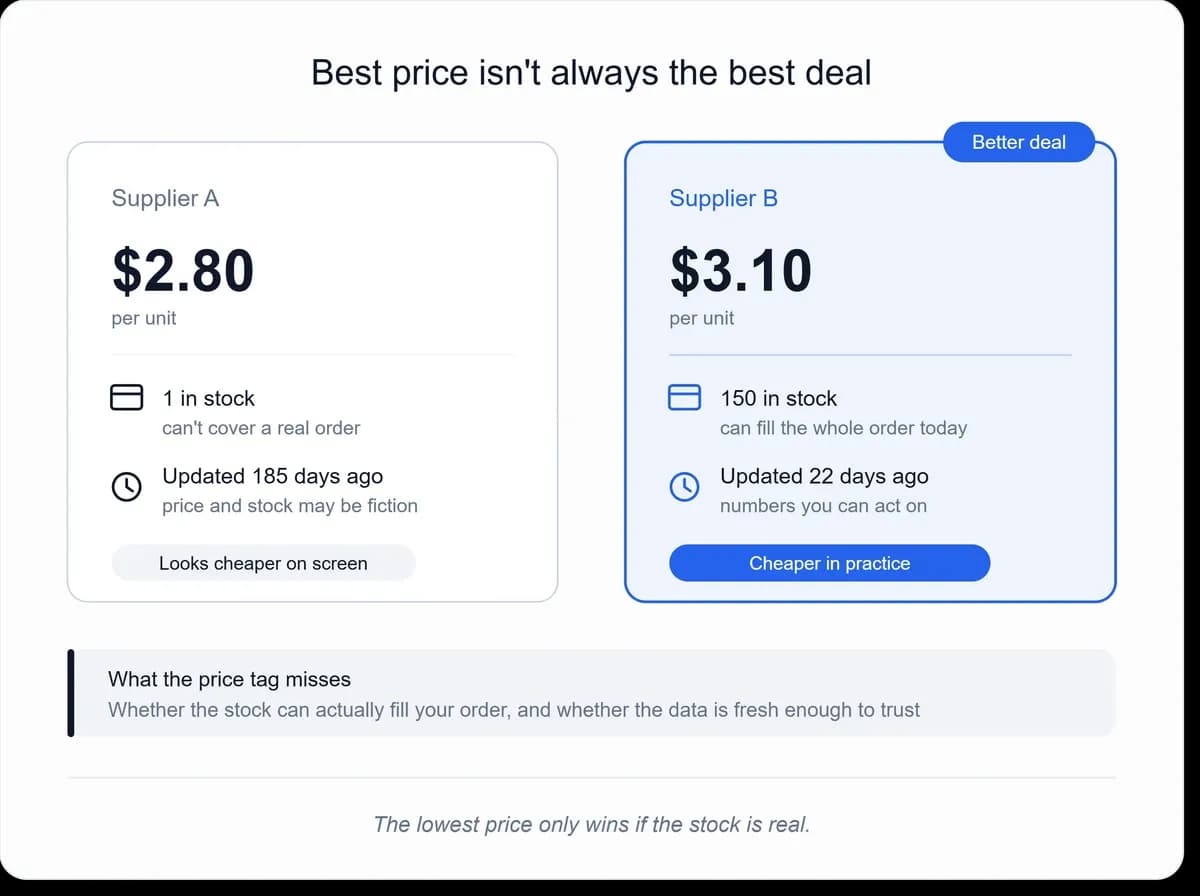
Say Supplier A lists $2.80 per unit, with 1 unit in stock, last updated 185 days ago, and tagged as the best price. Supplier B lists $3.10 a unit, 150 units in stock, last updated 22 days ago. On a 1,000-unit order, Supplier A saves you $300 on paper.
Now factor in what the price tag doesn't show. If Supplier A's stale listing means a three-week wait before your order even starts production, and that delay pushes back a launch or a customer commitment, the cost of that delay is very likely more than $300.
A single unit in stock usually means every order, not just this one, gets made to order, so the same wait shows up again on your next reorder too. And a listing that hasn't been touched in six months is a reasonable early signal that the supplier isn't especially responsive once you actually need something from them.
None of this means the cheaper listing is automatically wrong. It means the price tag alone doesn't tell you enough to know. Before spending a credit based on price, it's worth checking whether the timeline actually works for you, whether the supplier can handle a reorder if this one goes well, and whether the other two numbers on the listing back up the price or quietly contradict it.
A Quick Checklist Before You Spend a Reveal Credit
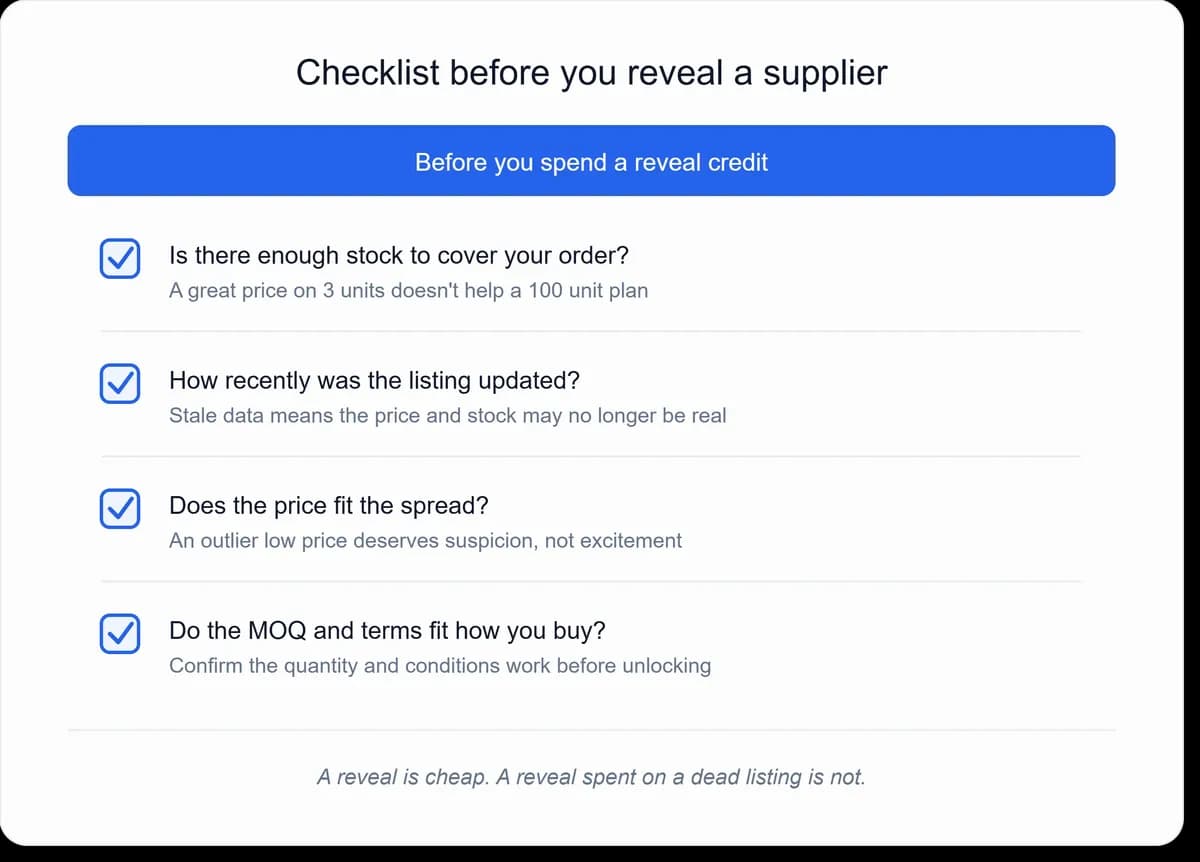
- Cost spread sits in a reasonable range for the category, and isn't wildly out of line with other suppliers for the same product
- Stock on hand makes sense against the supplier's minimum order quantity
- The listing was updated within the last 60 to 90 days, or the price and stock still look realistic if it's older
- The three numbers tell a consistent story rather than contradicting each other
A listing that clears most of these is usually worth a credit. One that raises two or three flags at once is worth a second look, or at minimum, going in with the right questions instead of assumptions.
Where to Actually Check These Numbers
Reading a listing like this is a lot faster when the numbers are already sitting in front of you instead of scattered across supplier emails and old price lists. On B2B Supplier Hub, every supplier listing shows the wholesale cost across quantities, current stock, and the date it was last verified, all before you spend anything to see who the supplier actually is.
If you're new to how the platform lays this out, how B2B Supplier Hub works walks through the whole path from a search to a revealed supplier, and our framework for comparing wholesale suppliers goes deeper into the factors worth weighing beyond price alone.
The Short Version
Cost spread tells you how a supplier's pricing actually behaves as volume changes. Stock depth tells you whether they can back up that price with real inventory for your order size, not just any order. The last-updated date tells you how much to trust both of the numbers above it. None of the three mean much on their own, and none of them is a substitute for actually reaching out. But together, they're usually enough to tell you which listings deserve a reveal credit and which ones deserve a second look first.
The B2B SupplierHub Team
Wholesale & sourcing
Stop hunting suppliers by hand. Type a UPC instead.
B2B Supplier Hub shows the suppliers in our network carrying a product on one page: wholesale cost, stock, and retail price side by side. Free to search, no card required.