
Wholesale Economics
Wholesale P&L Template: See Your True Profit by Product
Most wholesale resellers can name their best selling product in a second. Ask which product makes them the most money and the answer comes slower, and it is often a guess.
That is normal. The sales report shows what sold. It does not show what each product cost to buy, what the marketplace kept, or what the ads cost. Take those off and the order changes. The product that sells the most is often not the one that earns the most, and a quiet product halfway down the list is sometimes doing the real work.
A profit and loss (P&L) statement shows you this. Not the year-end one from your accountant, but a short one you fill in once a month, one row per product. It takes about half an hour. The template is below, along with the three mistakes that make it wrong.
If you want to check one deal before you buy, use our wholesale price calculator. If you want to know when the money lands in your bank, read the cash conversion cycle post. This one is about the whole business, month by month.
Cost of Goods Sold: Count Units Sold, Not Units Bought
This is the most common mistake in a reseller's monthly numbers, and it is an easy one to make. Say you pay a distributor $20,000 in October and put the whole $20,000 in October's expenses. October looks terrible. Then January comes around, you buy almost nothing, and suddenly it looks like the best month you have ever had. Neither month was real.
The right way is to count the cost of the units you actually sold in that month. Take the stock you started the month with, add what you bought, and take away what you still have at the end. What is left is your cost of goods sold for the month. So if you sold 500 units and each one cost you $10, that month's cost of goods is $5,000, however much you paid distributors in those same weeks.
Two details matter here. The first is that the cost of a unit includes what it took to get it to you. Under the IRS rules for goods bought for resale, cost means the purchase price plus the shipping and other charges you paid to get the goods. Inbound freight belongs in the cost of the unit, then, not in a separate overheads line. The second detail is discounts. Use the price you actually paid, not the list price. An early payment discount can be taken off the purchase cost or booked as income, but pick one way and keep to it every month.
None of this is tax or accounting advice. It is the formula every accountant already uses, laid out so your monthly sheet matches the books at year end. It is also why, if you are buying heavily this month for Q4, your October P&L will not show a loss that was never really there.
The Wholesale P&L Template (Products First, Then the Business)
A good wholesale P&L has two layers. The first is one row per product. The second adds those rows up and takes off the costs that do not belong to any single product. Here is the first layer.
Per Product, Per Month | Amazon | Walmart | eBay | Other |
|---|---|---|---|---|
Units sold | ||||
Sales (before any fees, without sales tax) | ||||
Refunds given back to customers | ||||
Fees kept by the marketplace on refunds | ||||
Cost of goods sold (units sold × landed cost) | ||||
Gross profit | ||||
Referral or marketplace fee | ||||
Fulfillment or shipping cost | ||||
Storage fee for the month | ||||
Aged inventory surcharge | ||||
Returns processing fee | ||||
Advertising | ||||
Reimbursements received (add back) | ||||
Supplier credits received (add back) | ||||
Contribution | ||||
Units in stock over 180 days |
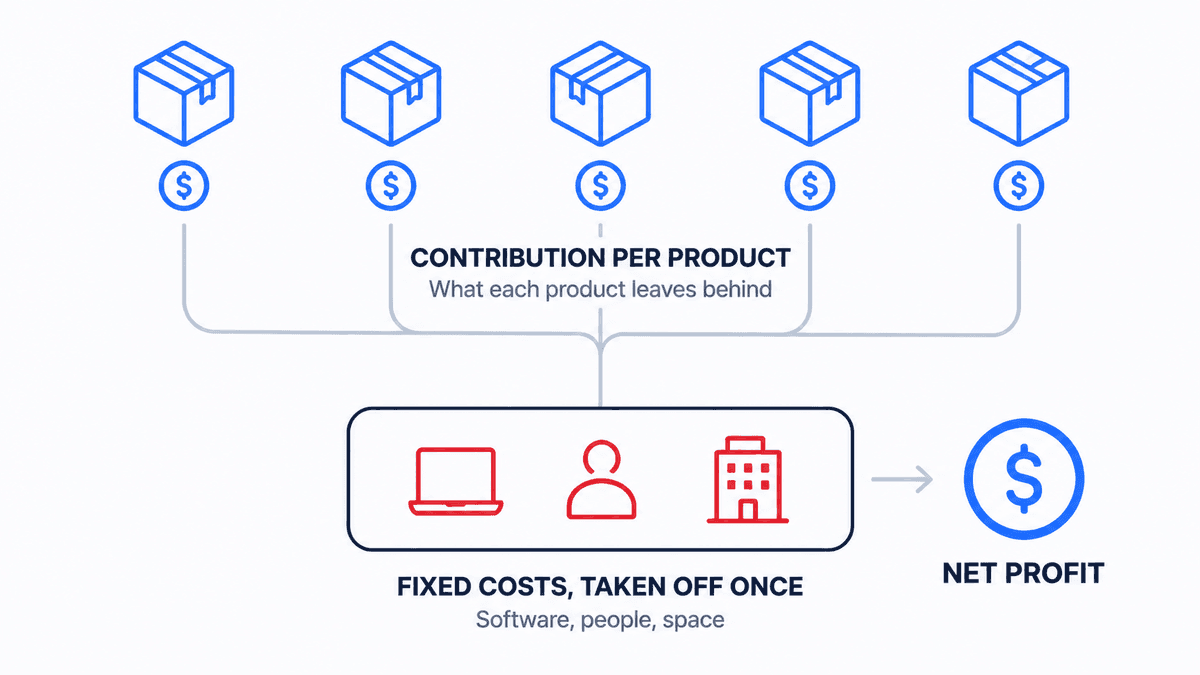
Contribution is the number that matters on this layer. It is what a product leaves behind once you take off every cost that only exists because you sell it. When it is positive, the product is helping. When it is negative, the other products are paying for it, and the sales figure will never tell you that.
The second layer is shorter. Add up the contribution of every product, then take off the costs that stay the same whether you sell one product or a hundred: software subscriptions, a virtual assistant or staff, your prep partner if you use one, warehouse or office space, accounting, and your own pay if you take one. What is left is the net profit of the business.
Do not try to spread those fixed costs across the products. It feels tidy, but whatever split you choose is a guess, and a bad guess can make a good product look like a loser. The honest question is whether all the products together cover the fixed costs, not whether each one covers its share.
There is one column per channel on purpose. Walmart and eBay charge different fees from Amazon, and a product that is thin on one channel can be perfectly fine on another. Keep each channel in its own column, then add across.
4 P&L Lines a Per-Deal Calculator Misses
A calculator works one unit at a time. Some costs and credits only show up over a whole month, so a calculator never sees them. These are the four that resellers most often leave out.
Sales tax is not your money. In every state with a sales tax, the big marketplaces collect the tax from the buyer and pay it to the state on your behalf. It passes through your account, but it was never your sale. If you sell on your own site, you collect it yourself, and it is still not your sale. If your sales line includes it, your revenue is inflated and your margin looks smaller than it is. Strip it out before you start.
Reimbursements come back at cost, not at price. When a unit is lost or damaged in the warehouse before anyone orders it, Amazon pays you your sourcing cost, not the selling price, and that cost excludes shipping, handling and duties. So a reimbursement is not income. It puts back most of what you paid for the unit, and the freight you paid to get it there is gone. Book it as an add-back against cost of goods, and enter your real cost per unit in your account settings, because if you leave it empty Amazon uses its own estimate instead.
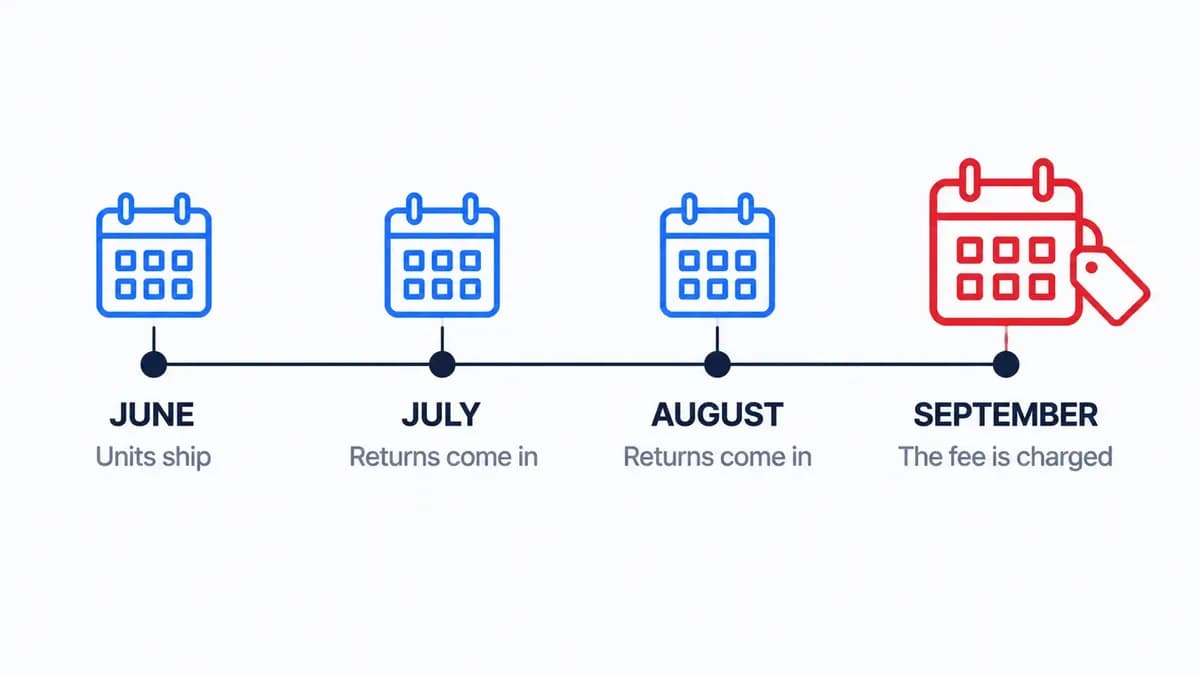
The returns processing fee lands three months late. If a product's return rate goes over the threshold for its category, Amazon charges a fee per returned unit. The catch for your P&L is timing. It is deducted between the 7th and 15th of the third month after the month the units shipped. A fee for June sales arrives in September. Put it against the month it belongs to, or one month's numbers will always look better than they were.
Supplier credits are real money. A short shipment credit, a damage allowance, a rebate at the end of a quarter. These are small and easy to forget, and they belong on the product they relate to as an add-back. If your distributor short-ships often, this line will also be the first place you notice.
Aged Inventory: The Cost That Hasn't Hit the Row Yet
Every product row in the template ends with a line for units that have been sitting more than 180 days. That is not a profit number, but it is the earliest warning you get that a profitable-looking product is about to stop being one.
Under Amazon's 2026 rate card, the aged inventory surcharge starts at day 181. It is $0.50 per cubic foot from day 181, rising to $1.50 by day 241, then jumping to $5.45 at day 271, and it is charged on top of the normal monthly storage fee. Confirm the current rates in Seller Central, because they change. For the P&L, the point is this: a product with 200 units over 180 days is carrying a cost that has not shown up in its row yet, and it will.
Why you end up with slow stock in the first place is usually about the order size, and we covered that math in the economics of MOQ. What this line does is make sure the P&L tells you before the fee does.
How to Read Your P&L: 3 Checks in Order
Once the month is filled in, look at three things, in this order.
First, any product with a negative contribution. These are the ones the rest of the business is paying for. The fix is usually one of three things: cut the ads, stop buying it, or accept it as a short-term loss for a reason you can name.
Second, any fee that grew faster than sales. If storage went up 30% and sales went up 5%, stock is building somewhere. If the fulfillment fee per unit changed, check whether the product's size tier moved.
Third, sort your products by total cost of goods, biggest first. Not by margin, by dollars. The product at the top of that list is where a lower buying cost is worth the most money to you. If you have been reordering it from the same distributor for a couple of years, you have not seen what anyone else charges for it in a couple of years either.
That last check takes a minute. Search the product free on B2B Supplier Hub and you see the real cost and real stock from every verified distributor in our network carrying it, side by side, with a date on each listing. Work down your list from the top. If a product is not in our catalog yet, submit a request and our team will find an authorized distributor who carries it. It is free on every plan, and you hear back within 30 days either way.
Make It a Monthly Half Hour
Set a day early each month and do this in one sitting. Pull the sales, fees and reimbursement reports for each channel. Pull your ad spend. Count or export your closing stock. Fill in the product rows, then the business layer. Then run the three checks above and write down one decision per check.
The first month takes longer than half an hour, because you are building the sheet. By the third month it is routine, and you will know something a lot of resellers never find out: not which product sells the most, but which one actually pays the bills. Start with the top of your cost-of-goods list, search that product free, and see whether the biggest line on your P&L could be smaller next month.
Frequently asked questions
01Is my Amazon payout the same as my profit?
02Do I count inventory when I buy it or when it sells?
03How do I record an Amazon reimbursement?
04What should an Amazon wholesale profit and loss include that a generic template does not?
The B2B SupplierHub Team
Wholesale & sourcing
Stop hunting suppliers by hand. Type a UPC instead.
B2B Supplier Hub shows the suppliers in our network carrying a product on one page: wholesale cost, stock, and retail price side by side. Free to search, no card required.